The Ultimate Guide to Social Media Analytics for Small Brands — What to Track, What to Ignore, and How to Grow in 2026
SnapReel
May 9, 2026 · 22 min read

Table of Contents
The Metrics That Feel Important Are Usually Not the Ones That Matter
Every small brand owner who has posted consistently on social media for more than two weeks knows the feeling. You check your post. It has 847 likes. You feel good. You check the next post. It has 312 likes. You feel bad. You post more of what got 847 likes and less of what got 312 likes. Your follower count goes up slowly. Your revenue stays flat.
This is the vanity metrics trap — and it catches almost every brand that does not have a clear understanding of which social media numbers actually connect to business outcomes and which ones are just noise that feels meaningful because platforms surface them prominently.
In 2026 the brands growing fastest on social media are not the ones with the most likes. They are not even the ones with the most followers. They are the ones that understand exactly which metrics predict real business outcomes — reach, saves, watch time, profile visits, link clicks, conversion rate — and make every content decision based on those numbers rather than the dopamine-adjacent metrics that platforms put in front of everyone by default.
This guide cuts through the noise. It tells you exactly which metrics matter for which goals, which metrics to stop tracking entirely, how to read your data correctly, and how to build a simple monthly analytics review that drives your content strategy rather than just validating your feelings about how it is going.
Understanding What Social Media Analytics Actually Tells You
Before getting into specific metrics, it is worth building a clear mental model of what social media analytics is actually measuring — because understanding the structure of the data makes it significantly easier to draw the right conclusions from it.
Social media analytics measures three fundamentally different things simultaneously, and confusing them leads to bad strategic decisions.
Reach metrics measure how many people your content is getting in front of. Impressions, reach, views, and follower count all belong to this category. These metrics tell you about the size of your potential audience — how many people had the opportunity to see your content. They say nothing about what those people did with it.
Engagement metrics measure how those people responded to your content. Likes, comments, shares, saves, watch time, and completion rate all belong to this category. These metrics tell you whether your content was valuable enough to prompt a reaction — and different types of reactions signal very different things about content quality and audience alignment.
Conversion metrics measure what those people did after engaging with your content. Profile visits, link clicks, website sessions from social traffic, email signups, and purchases all belong to this category. These are the metrics that connect social media activity to actual business outcomes — and they are the metrics that most small brands track least carefully because they require slightly more setup to measure properly.
The mistake most small brands make is optimizing heavily for reach metrics, moderately for engagement metrics, and barely at all for conversion metrics — which means they are optimizing for the metrics that feel good rather than the metrics that predict revenue.
The brands growing fastest in 2026 optimize for conversion metrics first, engagement metrics second, and reach metrics third — because that is the order in which these metrics connect to actual business outcomes.
The Vanity Metrics — What to Stop Tracking
Before getting into what to track, it is worth being explicit about the metrics that consume the most small brand attention and deliver the least strategic value.
Likes
Likes are the most visible metric on almost every social platform and the least useful for strategic decision-making. A like requires minimal investment from the viewer — a half-second tap — and signals nothing specific about their relationship to your brand, their purchase intent, or their likelihood to become a customer.
Platforms surface like counts prominently because likes are easy to generate and create positive reinforcement loops that keep users posting. But from a business perspective, a post with 2,000 likes and zero saves tells you that people felt positively about your content in a passing way — not that it was valuable enough to return to, share with someone specific, or act on.
Stop making content decisions based on like count. A post that generates 80 saves and 200 likes is performing better for your business than a post that generates 2,000 likes and 10 saves — and tracking only likes will tell you the opposite.
Follower Count as a Primary Metric
Follower count is the metric most brand owners care about most intensely and the one that correlates least reliably with revenue. A brand with 2,000 highly engaged followers who regularly buy, share, and advocate is a more commercially successful social media presence than a brand with 50,000 followers who scroll past every post.
Follower count matters as a directional indicator — you want it to grow over time — but it should never be the primary metric you optimize for or the number you use to evaluate whether your social media strategy is working. Brands that optimize for follower growth above everything else tend to attract exactly the wrong type of followers — passive, unaligned audience members who happened to encounter the brand once and followed without genuine interest.
Impressions Without Context
Impressions — the total number of times your content was displayed — tell you almost nothing on their own. A post with one million impressions and a 0.1% engagement rate is reaching an audience that is completely uninterested in your content. A post with 10,000 impressions and a 15% engagement rate is reaching a highly aligned audience that finds your content genuinely valuable.
Impressions become useful when read in relationship to engagement rate — but on their own they are a reach metric that says nothing about content quality, audience alignment, or business impact.
The Metrics That Actually Matter — Platform by Platform
Now the important part. Here are the specific metrics that actually predict content quality, audience alignment, and business outcomes — organized by platform and by the type of insight each metric provides.
The Universal Metrics — These Matter on Every Platform
Engagement Rate
Engagement rate is total engagements divided by total reach, expressed as a percentage. It is the single most important metric for understanding whether your content is connecting with your audience — because it measures the proportion of people who saw your content and found it valuable enough to respond, not just the raw count.
In 2026 a healthy engagement rate varies by platform and follower count but general benchmarks are 1% to 3% for larger accounts and 3% to 8% for smaller, more niche accounts. Consistently below 1% suggests content-audience misalignment. Above 5% on a growing account suggests strong niche authority.
Track engagement rate per post, per content type, and per content pillar. This tells you which content categories are resonating most strongly with your audience and should inform how you allocate your content production effort.
Save Rate
Saves are the highest-value engagement signal on Instagram and an increasingly important signal on TikTok and Pinterest. A save means a viewer found your content valuable enough to want to return to it — which is a significantly stronger signal of genuine value than a like, which requires no future intent.
Calculate your save rate as saves divided by reach. A save rate above 1% is strong. Above 3% is exceptional. Content that drives high save rates is content that your audience considers reference material — how-to content, educational content, resource lists, step-by-step guides — and should be produced consistently because the algorithm weights it heavily in distribution decisions.
Share Rate
Shares extend your content to audiences that have no prior connection to your brand — every share is free distribution to a new potential audience delivered with the implicit endorsement of whoever shared it. Share rate is shares divided by reach and is particularly important for reach growth strategy.
Content that drives high share rates typically falls into specific categories — content that validates a belief your audience holds, content that is so useful they want their network to have it, content that is surprising or counterintuitive enough that sharing it reflects well on the person sharing, and content that makes someone laugh hard enough to want others to see it.
Understanding which of your content categories drives the highest share rate tells you which formats to use when reach growth is your primary goal.
Profile Visit Rate
Profile visits from content indicate that a viewer found your post compelling enough to want to know more about you — suggesting purchase consideration, follow intent, or genuine brand curiosity. Profile visit rate is profile visits divided by reach and is one of the clearest indicators of content that is driving real brand interest rather than passive entertainment.
High profile visit rates on specific content types tell you which content formats are most effective at converting passive viewers into potential customers — which should directly inform your bottom-of-funnel content strategy.
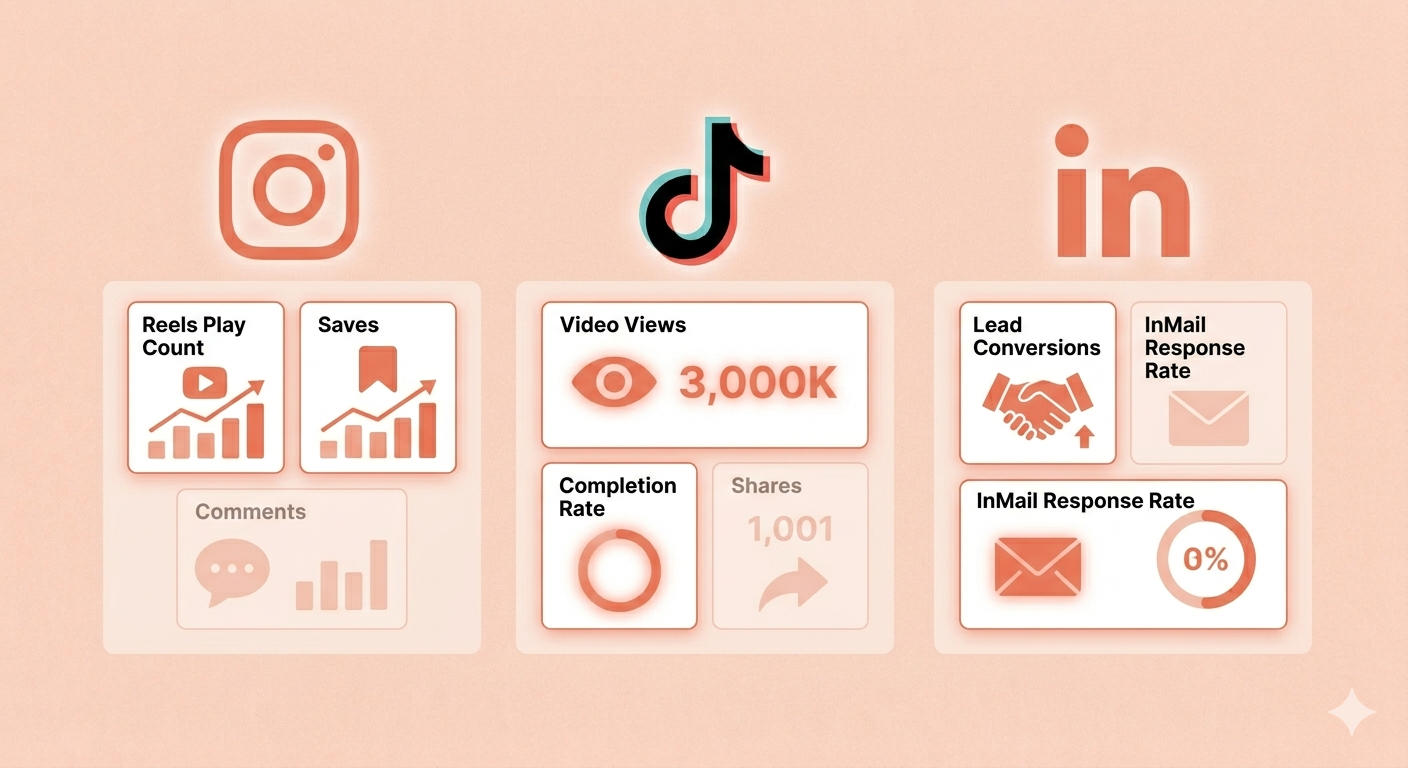
Instagram-Specific Metrics That Matter
Reel Watch Time and Completion Rate
Instagram surfaces two video performance metrics that are particularly important for strategic decisions — average watch time and completion rate. Average watch time tells you how long the typical viewer stays with your content before scrolling away. Completion rate tells you what percentage of viewers watch all the way to the end.
A completion rate above 50% is strong. Above 70% is exceptional. Low completion rates — particularly if the drop-off happens in the first three seconds — tell you your hook is not working. Drop-off in the middle of the video suggests the content loses momentum after a strong start. Drop-off at the end suggests the conclusion is weaker than the setup.
These metrics are the most direct feedback available for improving video quality because they tell you specifically where your audience is losing interest — which is information you can act on immediately in your next production cycle.
Story Completion and Exit Rate
For Instagram Stories, the metric equivalent of video completion rate is story completion — what percentage of viewers watch through all slides of your story sequence — and exit rate — what percentage of viewers left your story at each slide.
High exit rate on a specific story slide tells you that slide is where your story loses people. High completion rate across your story sequence indicates your story structure is working — viewers are engaged enough to swipe through the entire sequence rather than tapping away.
Saves to Reach Ratio on Carousels
Carousel posts should be evaluated primarily on save rate because the multi-slide format is specifically designed to deliver reference value — step-by-step guides, lists, comparisons, tutorials — that viewers want to return to. A carousel with a low save rate relative to its reach is not delivering the reference value that the format is designed for and should be reconsidered at the concept level.
TikTok-Specific Metrics That Matter
Average Watch Time and Percentage Watched
TikTok's algorithm is more heavily weighted toward watch time than any other platform — because watch time is the clearest signal of genuine content value in a short-form video feed where alternatives are one scroll away.
Track both average watch time in seconds and average percentage watched. A video where 60% of viewers watch 80% or more of the content is performing exceptionally. A video where viewers average only 20% watch time tells you the hook is working — people are stopping to watch — but the content is not delivering on the promise of the hook.
For You Page (FYP) Ratio
TikTok analytics shows what percentage of your views came from the For You Page — content recommendation to non-followers — versus your followers or other sources. A high FYP ratio indicates strong algorithmic distribution — the algorithm is showing your content to new audiences who have no prior connection to your brand.
Track your FYP ratio by content type. If educational content gets 80% FYP distribution and product demonstration content gets 30%, the algorithm is telling you which format it considers most broadly valuable — which should influence how you balance your content mix.
Follower Growth Per Video
Track how many new followers each video generates. This metric tells you which specific content types are compelling enough to convert passive viewers into genuine followers — which is the conversion that transitions a reach event into a relationship.
LinkedIn-Specific Metrics That Matter
Comment Quality and Count
On LinkedIn comments are the dominant algorithmic signal — far more important than likes or reactions. A post that generates 20 substantive comments will be distributed to significantly more people than a post with 200 reactions and 3 comments.
Track comment count and periodically review comment quality. Comments that extend the conversation, share professional experiences, or ask genuine follow-up questions are high-quality signals. Comments that are generic reactions are lower-quality signals.
Post Impressions Versus Engagement Rate
LinkedIn's algorithm has a specific behavior that other platforms do not — it distributes content in waves. A post that performs well in its first two hours gets a second distribution wave that can multiply its initial reach by five to ten times. A post that underperforms in the first two hours gets minimal additional distribution.
This means posting time matters more on LinkedIn than on other platforms. Identify when your specific audience is most active on LinkedIn — typically Tuesday through Thursday mornings for professional audiences — and consistently post during those windows.
Profile Views From Posts
LinkedIn shows you how many profile views each post generated. For B2B brands this is one of the most important conversion metrics available — a profile view suggests that the content was compelling enough to trigger professional interest in who you are and what you do.
High profile view rates from specific post types tell you which content positions you most effectively as the credible, knowledgeable solution your target business audience is looking for.
Let SnapReel handle the content side while you focus on reading the numbers that grow your brand.
Create AI-powered videos and auto-post to all your platforms.
The Conversion Metrics Most Small Brands Are Not Tracking
The metrics above measure content performance — how your content is resonating with audiences on the platform. The metrics below measure business performance — how your social media activity is translating into actual business outcomes. Most small brands track the former closely and the latter barely at all.
Website Traffic From Social Media
Every major analytics platform — Google Analytics, Plausible, or any equivalent — shows you how much traffic each social media platform is sending to your website and what those visitors do when they arrive. This data is the bridge between social media activity and business outcomes.
Track monthly traffic from each platform separately. Track the pages those visitors land on. Track whether they complete meaningful actions — signup, purchase, contact form — at a higher or lower rate than visitors from other traffic sources.
This data tells you which platforms are sending you the highest-value traffic — not just the most traffic. A platform sending 500 visitors per month who convert at 5% is more valuable than a platform sending 2,000 visitors per month who convert at 0.5% — and without tracking this you cannot make the platform investment decisions that actually drive revenue.
Email List Growth From Social
If you use social media to grow your email list — through lead magnets, newsletter promotions, or gated content — track how many email subscribers each platform generates monthly. Email subscribers are the highest-value audience asset a brand can build from social media because email subscribers have explicitly consented to a direct communication relationship that no algorithm can interrupt.
Tracking email growth per platform tells you which platforms are driving the most durable audience relationships — which is particularly valuable for long-term brand building strategy.
Social Commerce Revenue
If your brand uses TikTok Shop, Instagram Shopping, or any other native social commerce feature, track revenue from each platform monthly and revenue per content piece. Which videos drove the most product page visits? Which drove the most add-to-carts? Which drove the most completed purchases?
This granular social commerce data is the most direct feedback loop available for small brand social media strategy — it connects individual pieces of content to specific revenue outcomes and tells you precisely which content formats and topics drive purchasing behavior versus passive engagement.
Customer Acquisition Source
Ask new customers where they heard about your brand. This simple question — added to a post-purchase survey, an onboarding email, or a checkout flow — captures attribution data that platform analytics cannot provide on its own. Many customers discover a brand through social media but complete their purchase through a direct visit, a Google search, or an email — which means last-click attribution significantly undercounts social media's contribution to customer acquisition.
Tracking customer acquisition source over time builds a picture of which platforms and which content types are most influential in your customer's discovery journey — even when that influence does not show up directly in click-through data.
Building Your Monthly Analytics Review — The 30-Minute Framework
Knowing which metrics matter is one thing. Building a sustainable practice of actually reviewing them and acting on what they show is another. Here is the simple monthly analytics review framework that small brands can execute in 30 minutes and that consistently improves content strategy over time.
Week 4 of every month — pull the data (10 minutes)
Export or screenshot your performance data from each platform for the month. You need engagement rate by post, save rate by post, watch time or completion rate for video content, profile visit counts, website traffic from social, and any conversion data — email signups, social commerce revenue, or other business outcomes you are tracking.
You do not need a sophisticated analytics dashboard for this. A simple spreadsheet with one row per post and columns for each key metric is enough to identify the patterns that drive strategic decisions.
Identify your top five and bottom five (5 minutes)
Sort your posts by engagement rate and identify your top five performers and your bottom five performers for the month. Look for patterns — what do the top five have in common? Is it a specific content type, a specific topic, a specific hook style, a specific posting time? What do the bottom five have in common?
These patterns are your content strategy intelligence. The top five are telling you what to produce more of. The bottom five are telling you what to produce less of.
Review conversion metrics separately (5 minutes)
Check your website traffic from social, email list growth, and any social commerce revenue data. Note which platforms sent the most valuable traffic — not just the most traffic. Note whether any specific post drove a notable spike in conversion activity.
This review should take five minutes and will often surface surprising insights — content that performed modestly on engagement metrics but drove disproportionate conversion activity, or content that performed strongly on engagement metrics but drove no meaningful conversion.
Write three strategic decisions for next month (10 minutes)
Based on the data you have reviewed, write three specific content strategy decisions for the next month. These should be actionable and specific — not "post more educational content" but "produce two keyword-optimized how-to Reels per week targeting the search phrases identified as highest-volume in our niche."
Three decisions per month sounds like very little. Over 12 months it produces 36 data-driven strategic adjustments — which compounds into a content strategy that is increasingly precisely calibrated to what your specific audience actually responds to.
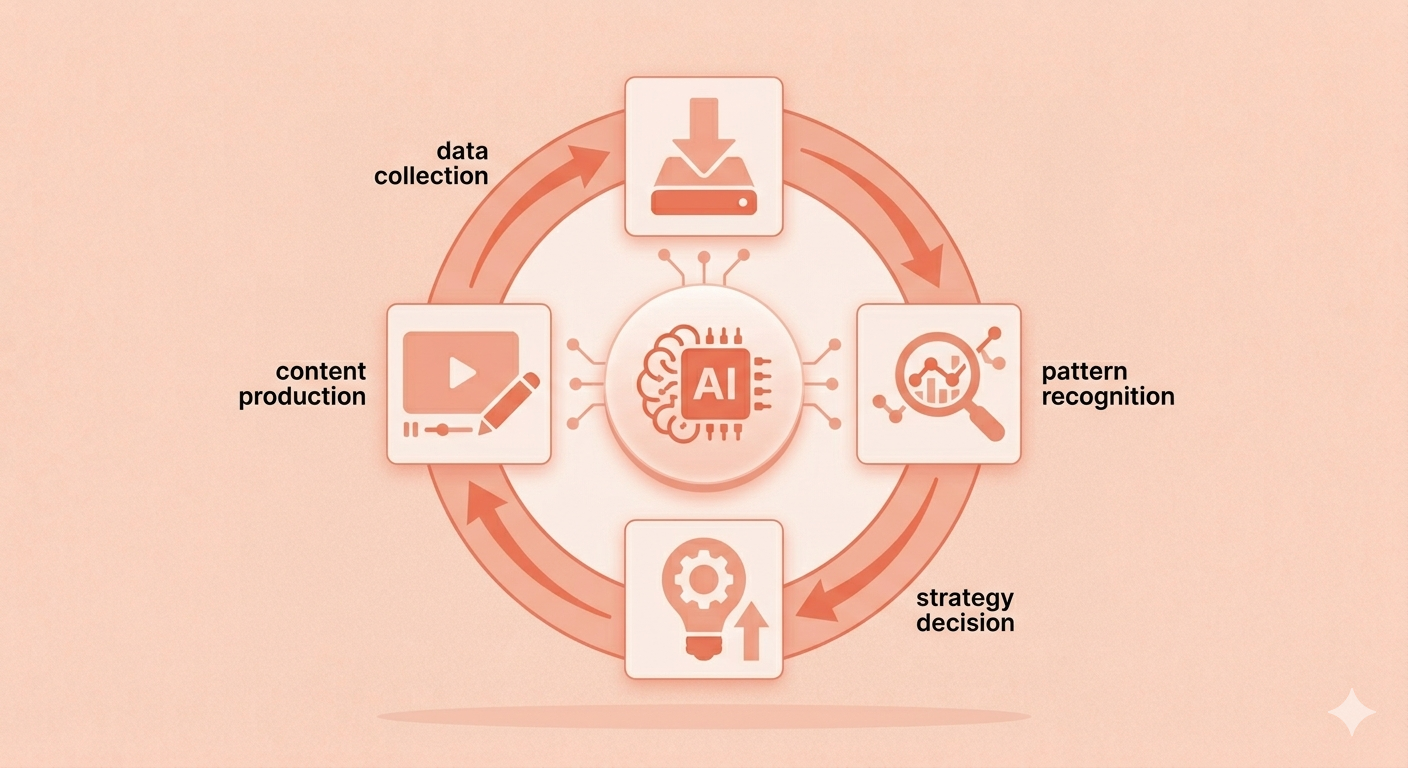
How AI Is Transforming Social Media Analytics for Small Brands
The analytics review framework above is achievable manually. AI tools make it faster, more comprehensive, and more actionable.
AI analytics tools in 2026 do not just display your performance data — they interpret it. They identify patterns across hundreds of data points simultaneously — content type, hook style, caption length, posting time, topic category, hashtag set — and surface the combinations that are driving your strongest performance. A human reviewing a spreadsheet might notice that educational posts perform better than promotional posts. An AI analytics tool notices that educational posts published on Tuesday mornings with a specific hook style and a save call-to-action outperform all other content combinations by 340%.
This level of pattern recognition is what separates brands that make marginally better content decisions each month from brands that make dramatically better content decisions each month — and over 12 months the compounding effect on content performance is significant.
AI tools also close the loop between analytics and production. When your monthly review identifies a high-performing content pattern, AI content generation can immediately produce more content in that pattern — no production delay, no briefing process, no waiting for the next content cycle. The insight and the execution happen in the same session.
The Analytics Mistakes That Mislead Small Brands
Understanding what to track is essential. Understanding the common misinterpretations that lead brands to draw wrong conclusions from correct data is equally important.
Comparing absolute numbers instead of rates. A post that reaches 50,000 people and gets 1,000 likes has a 2% engagement rate. A post that reaches 500 people and gets 50 likes also has a 2% engagement rate. These posts are performing equally well — but comparing them by absolute like count creates a false impression that the first post is 20 times more successful. Always compare rates, not absolute numbers, when evaluating content performance across posts with different reach levels.
Drawing conclusions from single data points. One high-performing post does not establish a pattern. One low-performing post does not either. Content performance has significant natural variance — even the best content strategy produces posts that underperform for reasons that have nothing to do with content quality, including posting time anomalies, platform algorithm shifts, and temporary audience activity fluctuations. Draw strategic conclusions from patterns across five or more data points, not from individual posts.
Attributing performance to the wrong variable. When a post performs exceptionally well, the natural instinct is to identify one thing that was different about it and attribute the performance to that thing. But social media post performance is the product of multiple variables interacting simultaneously — content type, hook style, caption optimization, posting time, trending context, and algorithmic variance all affect performance at the same time. Isolate variables deliberately by changing one element at a time in your content experiments rather than changing everything at once and then guessing at what drove the results.
Ignoring platform context in performance evaluation. A post that performs at average engagement rate on TikTok might be performing at exceptional engagement rate on LinkedIn — because average engagement rates differ significantly across platforms. Evaluate performance against platform-specific benchmarks and your own account's historical baseline rather than applying a single standard across all platforms.
Measuring too frequently. Checking analytics daily produces noise that feels like signal. The natural variance in daily post performance creates emotional swings — excitement after a high-performing day, discouragement after a low-performing day — that bear no relationship to actual content strategy quality. Monthly review cycles produce the smoothed, trend-level data that actually drives strategic improvement. Daily checking is an anxiety management behavior disguised as strategic diligence.
The Analytics Mindset That Separates Growing Brands From Stagnant Ones
Beyond the specific metrics and review frameworks, there is a mindset difference between small brands that use analytics to grow and small brands that use analytics to validate.
Brands that use analytics to validate are looking for confirmation that their instincts were right. They check which posts performed best and feel good when their favorite posts performed well and feel bad when content they put effort into underperformed. They make modest adjustments based on what they already believed was true.
Brands that use analytics to grow are looking for surprises. They are specifically interested in the data that contradicts their assumptions — the content type they thought would underperform that is actually their highest-engagement format, the posting time they thought was wrong that is actually driving their strongest profile visit rates, the topic they considered too niche that is actually generating their best conversion data.
These surprises are the most valuable output of any analytics review because they reveal things about your audience that you could not have known from intuition alone. An audience that surprises you is an audience you are learning from. An audience that always confirms your existing beliefs is an audience whose data you are filtering selectively.
The brands growing fastest on social media in 2026 are the ones that approach their analytics with genuine curiosity — willing to be wrong about what they thought was working, willing to follow the data into content strategies they would not have chosen intuitively, willing to let their audience teach them what it actually values rather than insisting on their own content preferences.
That is the analytics mindset that compounds. And like every compounding process, the brands that build it earliest benefit most from the time it has to run.
Final Thoughts
Social media analytics is not about feeling good about your numbers. It is about understanding what your audience is telling you through their behavior — what they find valuable, what they scroll past, what they share, what they buy — and using that understanding to build content that serves them better with every passing month.
The metrics that feel most important — likes, follower count, impressions — are the metrics that platforms surface most prominently because they create the feedback loops that keep you posting. The metrics that actually drive business outcomes — save rate, watch time, profile visit rate, conversion from social traffic, social commerce revenue — require slightly more intention to track but deliver dramatically more strategic value.
Build a simple monthly review practice. Track the metrics that connect to revenue. Draw conclusions from patterns rather than individual posts. Let the data surprise you. Make three specific decisions each month based on what you learn.
Done consistently for six months, this practice transforms social media from a channel you are posting on into a channel you are optimizing — and the compounding improvement in content performance, audience quality, and revenue attribution over that period is the clearest possible demonstration of why analytics is not a reporting function for small brands.
It is a growth function.
SnapReel AI includes performance analytics that identify your highest-performing content patterns and automatically generate more content in those formats — closing the loop between data and production so your social media strategy gets smarter every month.