How to Measure Social Media ROI as a Small Brand — What to Track, What to Ignore, and What Actually Drives Revenue in 2026
SnapReel
May 18, 2026 · 13 min read

Table of Contents
Every small brand investing time and money in social media eventually asks the same question.
Is this actually working?
The question sounds simple. The answer is complicated by the fact that most of the numbers social media platforms show you by default are not the numbers that answer it. Follower count, likes, impressions, reach — these metrics are easy to see, easy to report, and almost entirely disconnected from whether social media is growing your business.
65% of marketing leaders say they must prove how social media supports business goals just to get leadership buy-in. For small brands where every dollar of marketing spend needs to justify itself, the pressure is even higher. Every hour spent on social media content, every tool subscription, every paid campaign needs to connect to a business outcome — not just to an impression count. Coalition Technologies
The good news is that social media ROI is more measurable in 2026 than it has ever been. The attribution tools, the tracking mechanisms, and the analytics infrastructure available to small brands right now make it possible to connect social media activity to real business outcomes with a level of precision that was previously only available to enterprise marketing teams.
Social media marketing delivers an average ROI of $5.20 for every $1 spent — but this aggregate masks wide variation. Your benchmark depends on business model, product price point, sales cycle length, and competitive intensity. LocaliQ
The brands generating that return are the ones measuring the right things and making decisions based on what the data actually shows. This guide gives you the complete framework — what to track, what to ignore, how to set up your measurement system, and how to interpret what you find.
The Fundamental Problem — Why Most Small Brands Are Measuring the Wrong Things
Before getting into what to measure, it is worth being direct about why so many small brands end up measuring the wrong things in the first place.
Social media platforms are designed to show you metrics that make their platforms look valuable. Impressions, reach, and follower growth are front and center in every native analytics dashboard because these numbers are large, they trend upward when content performs reasonably well, and they create the feeling that something meaningful is happening.
The problem is that someone seeing your post is not the same as someone buying from you. And a brand with ten thousand followers that generates ten sales per month is getting worse ROI from social media than a brand with two thousand followers that generates fifty sales per month.
Vanity metrics are surface-level numbers that look impressive but do not necessarily contribute to tangible business outcomes. A classic example is total follower count — having a large audience might look good on paper but does not automatically mean better engagement, more sales, or stronger brand loyalty. Uh
Performance metrics are the ones tied to specific business objectives — the numbers that show whether social media activity is actually moving someone closer to becoming a customer. Click-through rates, conversion rates, and customer acquisition costs are prime examples of actionable metrics that align with ROI. Uh
The shift from measuring vanity metrics to measuring performance metrics is the single most important change a small brand can make to its social media measurement practice. Everything else in this guide builds on that foundation.

The Social Media ROI Formula — And What It Actually Measures
The core ROI formula for social media is straightforward.
ROI equals value generated minus cost of investment, divided by cost of investment, multiplied by 100. As an example: if you spend five thousand dollars per month on social media including tools, ads, and staff time, and attribute fifteen thousand dollars in revenue to social media campaigns, your ROI is two hundred percent. National University
The formula is simple. The complexity is in defining "value generated" and "cost of investment" accurately enough for the formula to mean something.
On the cost side, most small brands significantly undercount their social media investment. Costs encompass more than ad spend. Add employee hours, content production expenses, software subscriptions, and agency fees. A five thousand dollar ad campaign that requires forty hours of internal work at fifty dollars per hour actually costs seven thousand dollars. LocaliQ
Accurately counting costs includes the time your team spends on content creation, community management, analytics review, and strategy — not just the direct spend on ads and tools. When these time costs are included, the ROI calculation becomes significantly more honest and more useful for making decisions about where to invest your limited marketing resources.
On the value side, the challenge is that social media creates value in ways that are both directly trackable and indirectly influential.
Direct value is straightforward — someone clicks a link in your bio or story, visits your product page, and purchases. That revenue can be attributed to social media with reasonable confidence using UTM tracking.
Indirect value is more complex — someone sees your brand on Instagram five times over three weeks, searches your brand name on Google, visits your website, and purchases. The social media activity influenced that purchase, but it does not show up in last-click attribution as a social media conversion.
Some of social media's most valuable returns are not captured in revenue attribution. Failing to account for these understates your ROI and leads to under-investment in social media. A complete measurement approach accounts for both. National University
The Metrics That Actually Matter for Small Brand Social Media ROI
Click-Through Rate — The Bridge Between Content and Revenue
Click-through rate measures what percentage of people who see your content take action by clicking through to your website or landing page. It is the bridge between social media visibility and business outcomes.
A click-through rate above 5% is excellent for social ads. Anything below 1% indicates a need for better creative or targeting. Coalition Technologies
For organic content, CTR benchmarks are lower — but the principle is the same. Content that generates high click-through rates is content that connects strongly enough with the viewer to motivate action. Content with very low click-through rates is content that is being seen but not moving anyone toward the business.
Tracking CTR by content type, platform, and topic tells you which content is actually creating business momentum versus which content is generating views without any downstream effect on the business.
Conversion Rate — The Metric That Connects Social to Revenue
Conversion rate measures what percentage of the people who click through from social media to your website actually complete a meaningful action — a purchase, a lead form submission, an email signup, or a free trial.
This metric is where the gap between social media performance and business impact most often reveals itself. A piece of content can generate high click-through rates but low conversion rates — meaning it is attracting people who are curious but not ready to buy, or that the landing page experience is not aligned with the promise the content made.
The most important metrics are conversion rate, cost per acquisition, assisted conversions, revenue attributed to social, and qualified traffic. Sprout Social
For small brands tracking conversion rate from social media, the key is making sure every link shared on social goes to a specific landing page with tracking in place — not to a homepage or a generic product category page where the conversion path is unclear.
Cost Per Acquisition — The Efficiency Metric Every Small Brand Needs
Cost per acquisition measures how much your brand spends on social media activity — including both paid campaigns and the time cost of organic content — to acquire each new customer.
This metric is the most direct indicator of social media efficiency for small brands. If your customer lifetime value is one hundred dollars and your cost per acquisition from social media is eighty dollars, your social media strategy needs significant rethinking regardless of how good your engagement metrics look.
If your customer lifetime value is five hundred dollars and your cost per acquisition is forty dollars, social media is one of the most efficient growth channels available to your brand — and increasing investment in it is a straightforward decision.
Platform performance varies significantly. Facebook and Instagram deliver the highest ROI according to global marketers, while Pinterest generates two times higher return on ad spend than Facebook and Instagram for some advertisers. Test multiple channels with small budgets before committing to scale. LocaliQ
Stop guessing what's working — let SnapReel create the content and track what your audience actually engages with.
Create AI-powered videos and auto-post to all your platforms.

Saves and Shares — The Intent Signals Most Small Brands Ignore
In 2026, saves and shares have emerged as among the most predictive engagement metrics for eventual purchase intent — and most small brands are still not tracking them separately from overall engagement.
In 2026, algorithms on platforms like LinkedIn heavily prioritize dwell time and saves over simple likes. Instagram explicitly weights saves and sends more heavily than likes in its distribution model. The reason is straightforward — saving a post requires active intent. Someone who saves your content is signaling that it is valuable enough to return to. IMPACT
For Instagram, prioritize saves and watch time over simple likes to reveal buying intent. Coalition Technologies
For small brands, tracking saves separately from total engagement reveals which content is genuinely driving consideration and purchase intent versus which content is generating passive positive reactions that do not connect to business outcomes.
Assisted Conversions — The Revenue That Attribution Misses
Last-click attribution — where all revenue credit goes to the final touchpoint before purchase — systematically undervalues social media because most social media touchpoints are not the last click before purchase.
A customer who discovers your brand through a TikTok video, follows you on Instagram, sees three more posts over two weeks, and then searches your brand name and purchases through Google organic search will show up in last-click attribution as a Google organic customer. Social media's role in creating the awareness and trust that led to that purchase is invisible in the last-click model.
Use UTMs, pixel tracking, and CRM data so the result reflects the full journey, not just the last click. That gives you a clearer view of what actually drives value. Sprout Social
For small brands, moving from last-click to multi-touch attribution requires setting up UTM parameters on every link shared across social channels. This is a one-time technical setup that dramatically improves the accuracy of social media ROI measurement going forward.
How to Set Up Social Media ROI Tracking — The Technical Foundation
Understanding which metrics matter is only useful if you have the tracking infrastructure to measure them accurately. For small brands, this infrastructure is simpler to build than most assume.
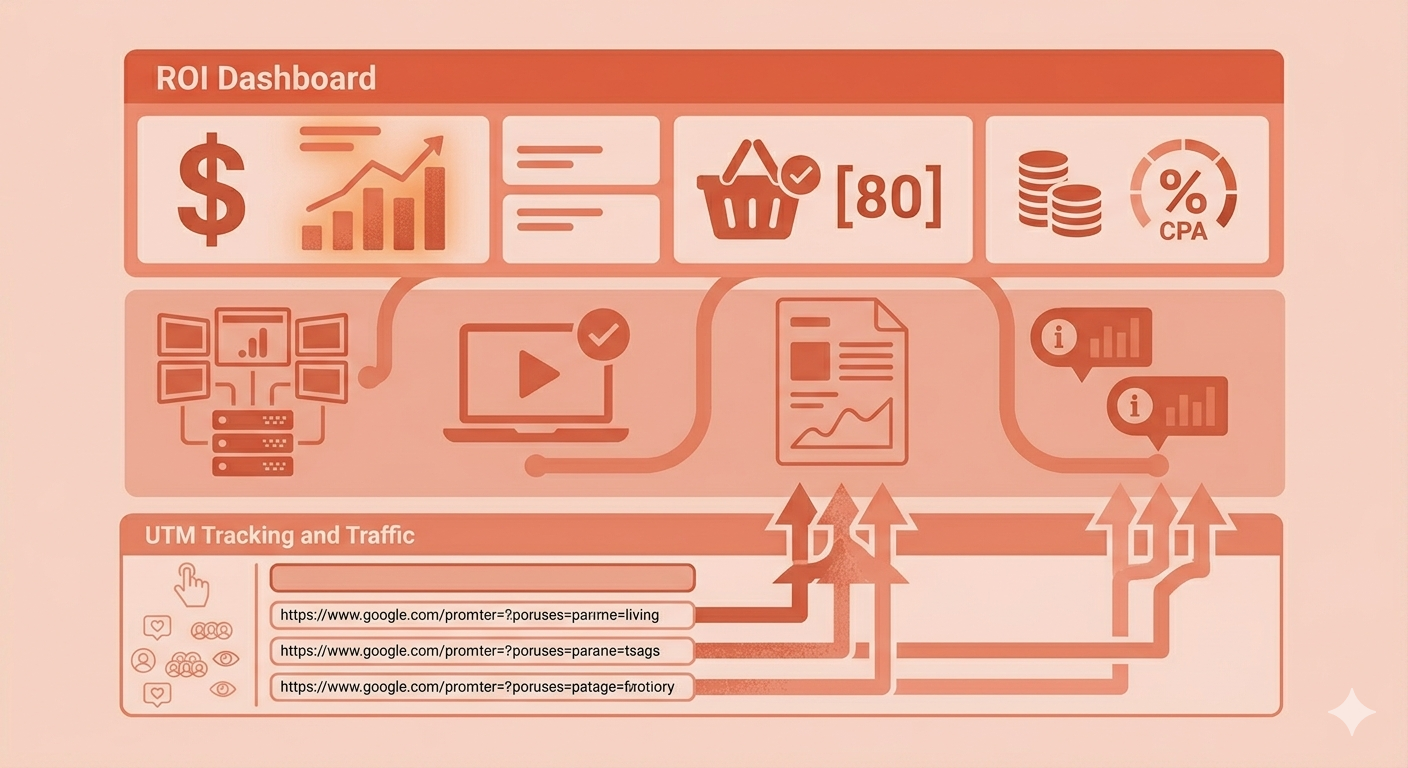
UTM parameters are the foundation of social media attribution. A UTM is a snippet of code added to the end of any URL shared on social media that tells your analytics platform exactly where the traffic came from. Use tracking links with UTM parameters and analytics platforms to attribute website actions to specific posts. Metricool
Every link shared in your Instagram bio, your TikTok profile, your LinkedIn posts, and your Facebook page should contain UTM parameters that identify the platform, the content type, and the specific campaign. This takes approximately thirty seconds per link and transforms your analytics from showing you traffic sources at the platform level to showing you which specific types of content on which specific platforms are driving meaningful actions on your website.
Google Analytics 4 is the tool that makes UTM tracking visible and actionable. Setting up conversion events in GA4 for every meaningful action on your website — purchases, email signups, lead form submissions, free trial activations — creates the bridge between social media traffic and business outcomes. In 2026, GA4 introduced cross-channel budgeting and scenario planning features, allowing you to move beyond simple reporting and into forecasting your social media ROI. IMPACT
For small brands with e-commerce operations, platform-native shop analytics — TikTok Shop, Instagram Shopping, and Facebook Shops — provide direct revenue attribution for purchases completed inside the platform without requiring UTM tracking for those specific transactions.
The Metrics to Stop Tracking — Or At Least Stop Making Decisions Based On
As important as knowing what to measure is knowing what to stop treating as meaningful data for business decisions.
Follower count is the most obvious metric to deprioritize. A growing follower count is a pleasant signal, but it tells you almost nothing about whether those followers are the right people, whether they are engaged, or whether they will ever convert to customers. A brand with two thousand highly engaged followers in its exact target customer profile is more valuable than a brand with twenty thousand passive followers who never interact with the content.
Impressions and reach should be monitored but not used as primary performance indicators. These metrics tell you how many times your content appeared in someone's feed — not whether it connected, moved, or motivated anyone to take action. High impressions with low CTR is a signal that the content is visible but not relevant enough to motivate action.
Likes have become the least useful engagement metric in 2026. They require one tap, carry no meaningful intent signal, and are the engagement metric most easily generated by content that is broadly appealing but not specifically valuable to your target customer. The algorithm platforms are themselves deprioritizing likes as a distribution signal — which is the clearest possible signal that small brands should do the same.
Building a Simple Monthly ROI Report for a Small Brand
The measurement framework that is most sustainable for a small brand is one that is simple enough to complete monthly without requiring a dedicated analyst.
A practical monthly social media ROI report for a small brand covers five things. First, total social media investment for the month — ad spend, tool subscriptions, and a time estimate for internal content work. Second, direct revenue attributed to social media through UTM tracking and native shop analytics. Third, conversion rate from social media traffic on the primary conversion action for each platform. Fourth, cost per acquisition for the month by platform. Fifth, the three highest-performing content pieces by the metric most relevant to business goals — saves for consideration content, CTR for conversion content, and completed views for awareness content.
There is no universal benchmark for social ROI. For paid campaigns, a 5:1 return is a standard expectation. Organic success typically manifests as increased leads, conversions, or improved customer retention over time rather than immediate revenue generation. Metricool
The purpose of the monthly report is not to produce a number that justifies social media to anyone. It is to identify which platforms, content types, and campaigns are producing the highest ROI so that next month's investment can be concentrated there — and the ones that are generating activity without business impact can be reduced or eliminated.
SnapReel AI's analytics layer tracks which video content formats and topics are generating the highest engagement signals from your specific audience — saves, profile visits, and click-throughs — so your ROI measurement practice starts with content performance data that is already organized around the metrics that connect to business outcomes, rather than the vanity metrics that fill most native social media dashboards.